Kubernetes Cluster Management
What we have learned
- What is a Pod?
- Minimal unit for Kubermetes
- Create a Pod
kubectl run db --image mongo- Declarative way using
yaml
- Monitor Pod health by using
livenessProbe - Using
RepicaSetto scale Pod - What is a Service?
- Service is an abstraction that defines a set of Pods and a policy to access them
- Service Type
- Cluster IP
- NodePort
- LoadBalancer
- ExternalName
- Create a Service
- Using
exposekubectl expose rs go-demo-2 --name=go-demo-2-svc --target-port=28017 --type=NodePort
- Declarative way using
yamlcat go-demo-2-svc.yml
- Using
- Use
Deploymentto createReplicaSet - Application Type
- Long-running => Deployment
- Batch => Job/CronJob
- Node-daemon => DaemonSet
- Stateful Application => StatefulSet
- Docker Network
- Kubernetes Network
- Pod Network
- Service Network
- NodePort, LoadBalancer and Ingress
Cluster Management
- Node isolation and recovery
- Scale the Kubernetes cluster
- Manage Namespace and Context
- Cloud Kubernetes Cluster Management
Node isolation and recovery
kubectl replace -f unschedule_node.yaml
Use kubectl patch:
kubectl patch node k8s-node-1 -p '{"spec": {"unschedulable": true}}'
Use kubectl cordon:
kubectl cordon k8s-node-1
kubectl uncordon k8s-node-1
Scale the Kubernetes cluster
- Install
Docker,kubelet,kube-proxy - Config start params for
kubeletandkube-proxy - Config Master URL to point to the master node of the cluster
Manage Namespace and Context
Create dev and prod namespaces:
kubectl create -f namespace-dev.yaml
kubectl create -f namespace-prod.yaml
kubectl config set-context ctx-dev --namespace=development --cluster=docker-for-desktop-cluster --user=docker-for-desktop
kubectl config set-context ctx-prod --namespace=production --cluster=docker-for-desktop-cluster --user=docker-for-desktop
Try to run a pod in production namespace:
kubectl run db --image mongo
Cloud Kubernetes Cluster Management
KOPS: https://github.com/kubernetes/kops
The easiest way to get a production grade Kubernetes cluster up and running.
Metrics and Logs Collection and Analysis
Horizontal Pod Autoscaling
Enable Pod to autoscale horizontally.
- Before Kubernetes 1.6, metrics are collected via
kubelet - After Kubernetes 1.6, metrics are collected via
API Server,Heapster,kube-aggregator
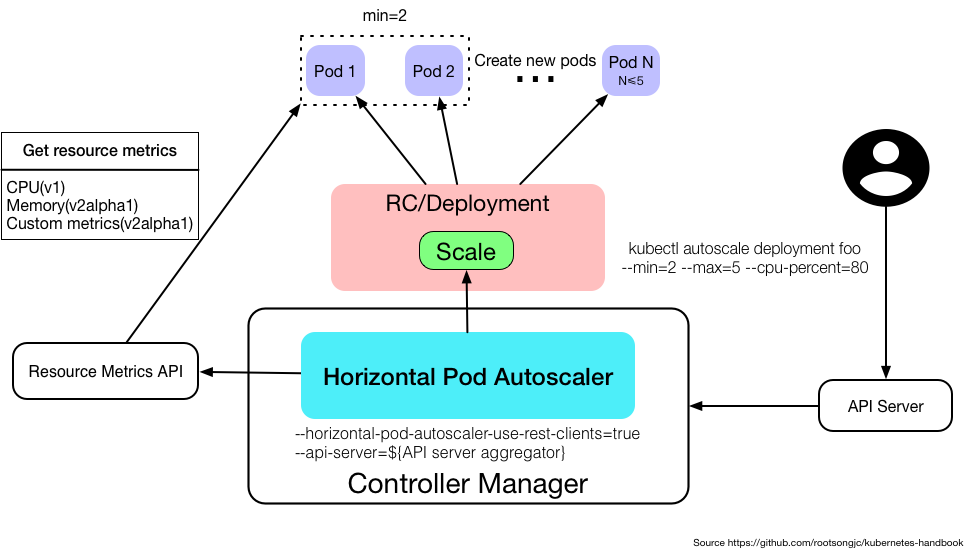
- Only apply to
DeploymentandReplicaSet - Only support autoscalling based on Pod CPU utilization for V1
- Support autoscalling based on Memory and other custom metrics for V1alpha
Manage HPA
Manage HPA using kubectl as other resource object such as Deployment:
kubectl create hpa
kubectl get hpa
kubectl describe hpa
kubectl delete hpa
Create HPA using kubectl autoscale:
kubectl autoscale (-f FILENAME | TYPE NAME | TYPE/NAME) [--min=MINPODS] --max=MAXPODS
[--cpu-percent=CPU] [flags] [options]
Sample:
kubectl autoscale deployment foo --min=2 --max=5 --cpu-percent=80
Cluster and Application Monitoring
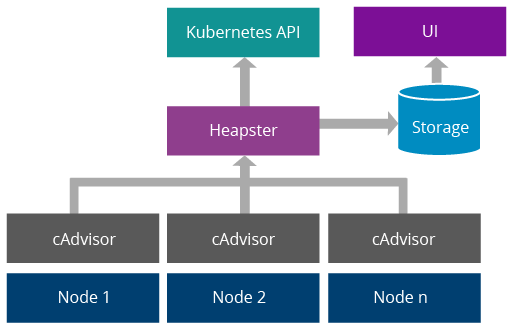
Heapster
Heapster is a default installed plugin for Kubernetes cluster. HPA uses Heapster as Resource Metrics API and get metrics data from it.
Start Heapster with option --api-server=true to achive this.
- Heapster can collect
cAdvisordata from Node. - Heapster can get CPU, Memory, Network and Disk metrics grouped by Kubernetes resources such as Pod and Namespace.
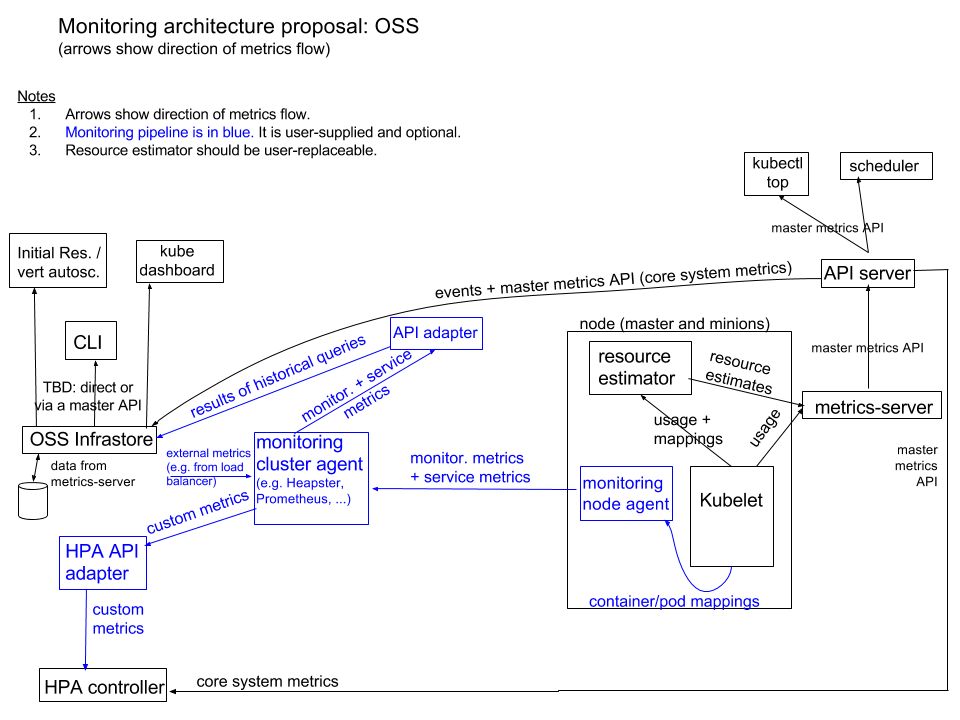
Metrics Server
Heapster is deprecated since Kubernetes 1.11. Release Note.
Metrics Server is a cluster-wide aggregator of resource usage data.
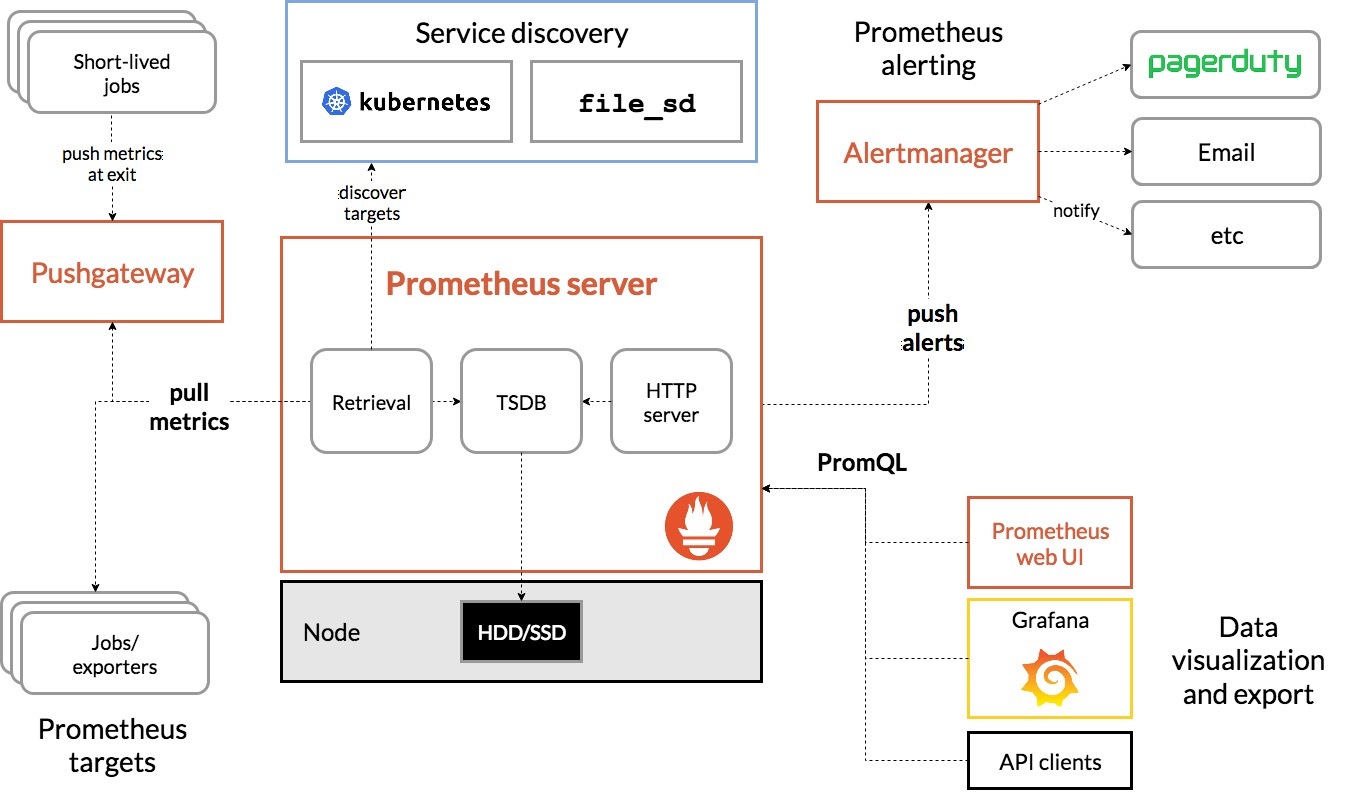
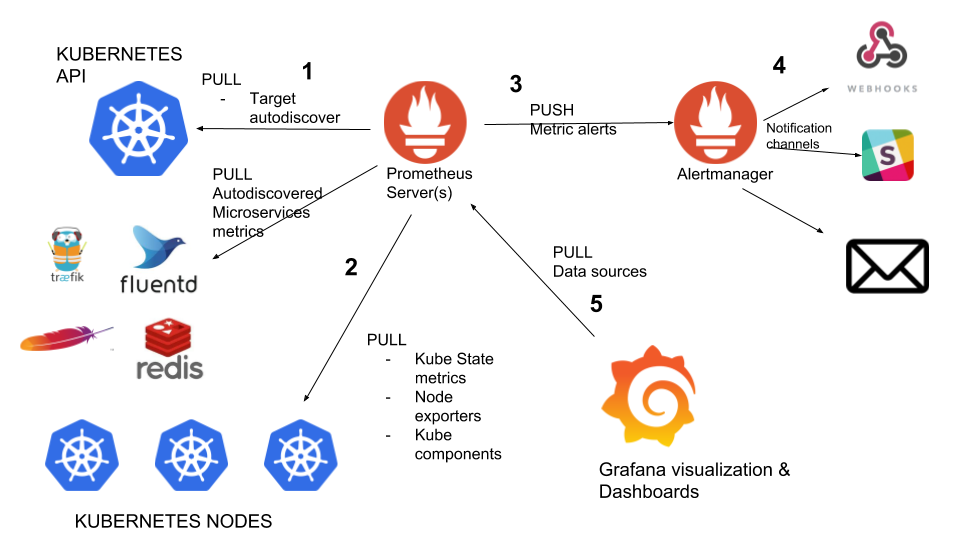
Prometheus
Prometheus is open-sourced by SoundCloud in 2015 and become the second project in CNCF in 2016.
Main functions
- Multi-Demensional Data
- Powerfull Query (PromQL)
- Efficient Storage (Support both local and remote)
- Pull using http protocol
- Easy opeation and friendly UI
Main Process
- Prometheus server periodically get configuration data from target
- When the pulled data is bigger than configed cache, flush to disk
- Prometheus can config rule and send alerts when condition triggers
- AlertManger receives the alerts, aggregate, dedup and send it
First Look at Prometheus
Prometheus Config File:
global:
  scrape_interval:     15s # Set the scrape interval to every 15 seconds. Default is every 1 minute.
  evaluation_interval: 15s # Evaluate rules every 15 seconds. The default is every 1 minute.
  # scrape_timeout is set to the global default (10s).

# Alertmanager configuration
alerting:
  alertmanagers:
  - static_configs:
    - targets:
      # - alertmanager:9093

# Load rules once and periodically evaluate them according to the global 'evaluation_interval'.
rule_files:
  # - "first_rules.yml"
  # - "second_rules.yml"

# A scrape configuration containing exactly one endpoint to scrape:
# Here it's Prometheus itself.
scrape_configs:
  # The job name is added as a label `job=<job_name>` to any timeseries scraped from this config.
  - job_name: 'prometheus'

    # metrics_path defaults to '/metrics'
    # scheme defaults to 'http'.

    static_configs:
    - targets: ['localhost:9090']
Start Prometheus:
./prometheus --config.file=prometheus.yml
Use Prometheus for Kubernetes
Using GKE and pre-requirement:
kubectl create clusterrolebinding my-cluster-admin-binding --clusterrole=cluster-admin --user=project.owner@gmail.com
Deploy Prometheus via GiantSwarm:
kubectl apply \
  --filename https://raw.githubusercontent.com/giantswarm/kubernetes-prometheus/master/manifests-all.yaml
List the service in namespace monitoring:
kubectl get svc --namespace monitoring
Use port forward to visit grafana:
export POD_NAME=$(kubectl get pods --namespace monitoring -l "app=grafana,component=core" -o jsonpath="{.items[0].metadata.name}")
kubectl port-forward --namespace monitoring $POD_NAME 3000:3000
Visit http://localhost:3000 with admin/admin credential.
Log Collection
- Splunk
- ELK
- Flume + Storm + Kafka + HDFS
TroubleShooting
Kubernetes Object Related Problems
kubectl describe pod <pod_name>
Possible reasons for Pod running failed:
- No available node for scheduling
- Resource Quata Management on and no available resource on the destination Node
- Pulling image failed
kubctl describe applies to other resources as well:
- Node
- Deployment
- Service
- Namespace
Service or Container Problems
kubectl logs <pod_name>
Use -c if the pod contains multiple containers:
kubectl logs <pod_name> -c <container_name>
If the container is down, Volume or other tools like fluentd are needed for the logs collection.
Cluster Problems
If Kubernetes cluster is managed by Linux using systemd:
systemctl status kube-controller-manager -l
Or config the logs directory for Kubernetes:
--logtostderr=false: do not output to stderr
--log-dir=/var/log/kubernetes: log folder
Some Common Problems
- Pod status is
pendingand Event hasimage pull failedkeyword- Make sure the repository is accessable from the Kubernetes Node
- Pod status is
runningbut notreadyand restarts count inceases- Change the start command to
foregroundinstead ofbackgroud
- Change the start command to
- Compute resources related:
- Pod status is
pendingand the error msg isFailedScheduling- Add more Nodes
- Stop some Pods to release resources
- Check the Pod configuration about
requestsandlimits
- Container is forces
Terminated- Resources used by container exceed the
Limits
- Resources used by container exceed the
- Pod status is
Recap
- Add/remove a Node for scheduling
- Scale up a cluster by adding new nodes
- Namespace and context
- Using
KOPSto manage cloud kubernetes cluster - HPA
- Heapster => Metrics Server
- Prometheus and Grafana
- Troubleshooting Tips
References
- https://github.com/giantswarm/kubernetes-prometheus
- https://jimmysong.io/kubernetes-handbook/practice/prometheus.html
- https://prometheus.io/
- https://kubernetes.io/docs/concepts/configuration/manage-compute-resources-container/
- https://kubernetes.feisky.xyz/pai-cuo-zhi-nan/index
- namespace-prod.yaml
- namespace-dev.yaml